Data Science Visualization & Analytics
Your Vision, Our Expertise
In today’s information-driven world, data is one of the most valuable assets a business can have—but it’s the insights within that truly drive growth. At VinnovateLabz, our Data Science, Visualization & Analytics services turn raw data into meaningful stories, helping you uncover patterns, trends, and actionable insights. From interactive dashboards to advanced predictive models, we empower businesses to visualize their performance, make informed decisions, and strategize for a successful future.
what we Offer?
At VinnovateLabz, we offer comprehensive Data Science, Visualization & Analytics services to transform raw data into actionable insights. Our solutions include interactive dashboards, predictive modeling, and advanced analytics to help you uncover trends, optimize performance, and make data-driven decisions with confidence.
Our Approach
Understanding Your Goals
We collaborate to identify your business objectives and key performance metrics
Data Collection & Preparation
We gather, clean, and organize raw data to ensure accuracy and relevance
Exploratory Data Analysis
We analyze data to uncover trends, correlations, and hidden patterns
Model Development
We build predictive models and advanced analytics tailored to your specific needs
Visualization Design
We create intuitive dashboards and visual reports to simplify data interpretation
Insights & Strategy
We deliver actionable insights and recommendations to drive informed decision-making
Key Features
Customizable Dashboards
Made just meet to your unique business metrics and goals.
Real-Time Updates
Access live data for immediate decision-making
Interactive Visuals
Drill down into data for granular insights
AI-Powered Analytics
Leverage machine learning for advanced forecasting
Mobile-Friendly Access
Monitor performance anytime, anywhere
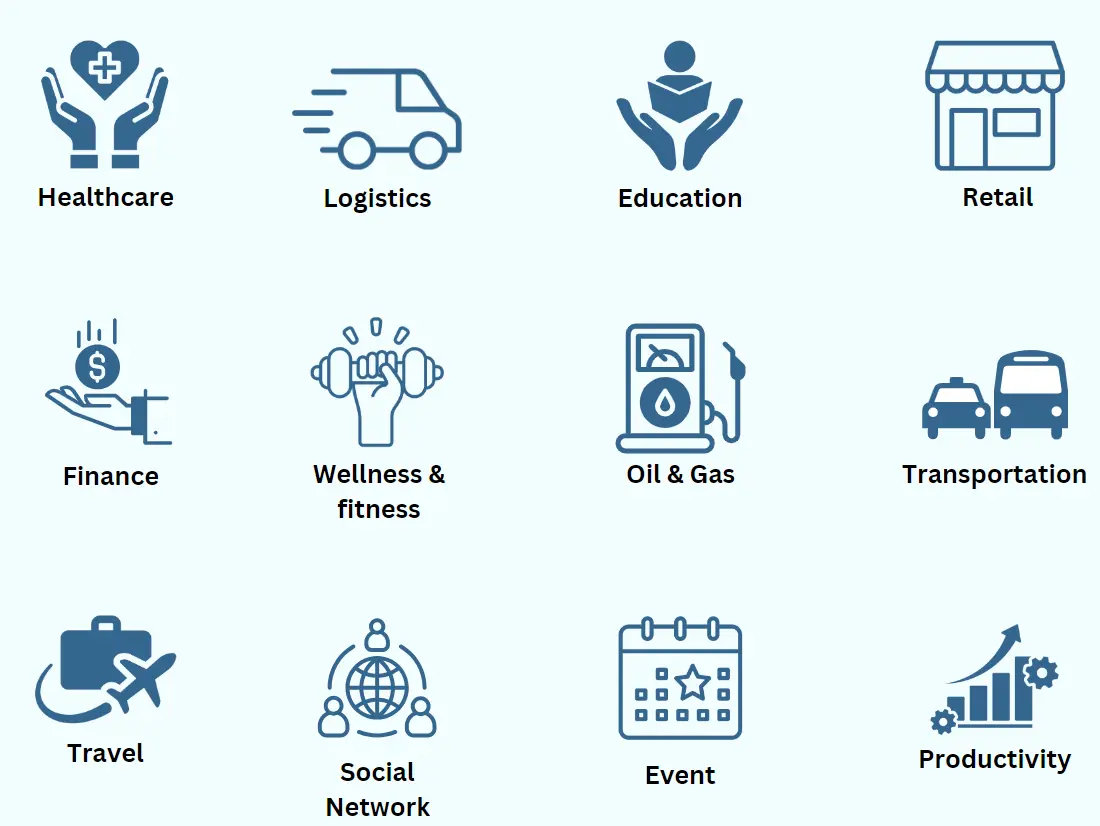
We do DSV & Analytics For All The Niches


Benefits of
DSV & Analytics
Why choose DSV & Analytics?
Enhanced Data Accuracy
Clean and structured data ensures reliable analysis and decision-making
Predictive Capabilities
Advanced modeling identifies future trends and opportunities, giving you a competitive edge
Interactive Dashboards
Real-time, customizable dashboards make complex data easy to understand and act upon
Scalable Solutions
Analytics frameworks grow with your business, adapting to evolving data needs
Informed Decision-Making
Unlock actionable insights to shape strategy and drive improved business outcomes effectively.
Operational Efficiency
Identify inefficiencies and optimize processes based on data-driven insights
Customer Understanding
Analyze behavior patterns to enhance customer experiences and loyalty
Strategic Growth
Use data-backed insights to seize opportunities and mitigate risks effectively
Let's Get Started
With Data Science Visualization & Analytics from VinnovateLabz, you can harness the full potential of your data to make smarter, faster decisions.
Contact us today to discuss your project and begin your journey toward data-driven success!

Frequently Asked Questions
We work with all types of data, including structured data (like databases) and unstructured data (such as text, images, or social media feeds).
We use a range of tools, including Python, R, Tableau, Power BI, SQL, and machine learning frameworks like TensorFlow and Scikit-learn, tailored to your project needs.
Our services help you uncover actionable insights, improve operational efficiency, understand customer behavior, and make smarter, data-driven decisions for sustainable growth.
If you have more questions, feel free to reach out to VinnovateLabz for personalized assistance!
